Summary
In Summary, you can follow 3 main parts:
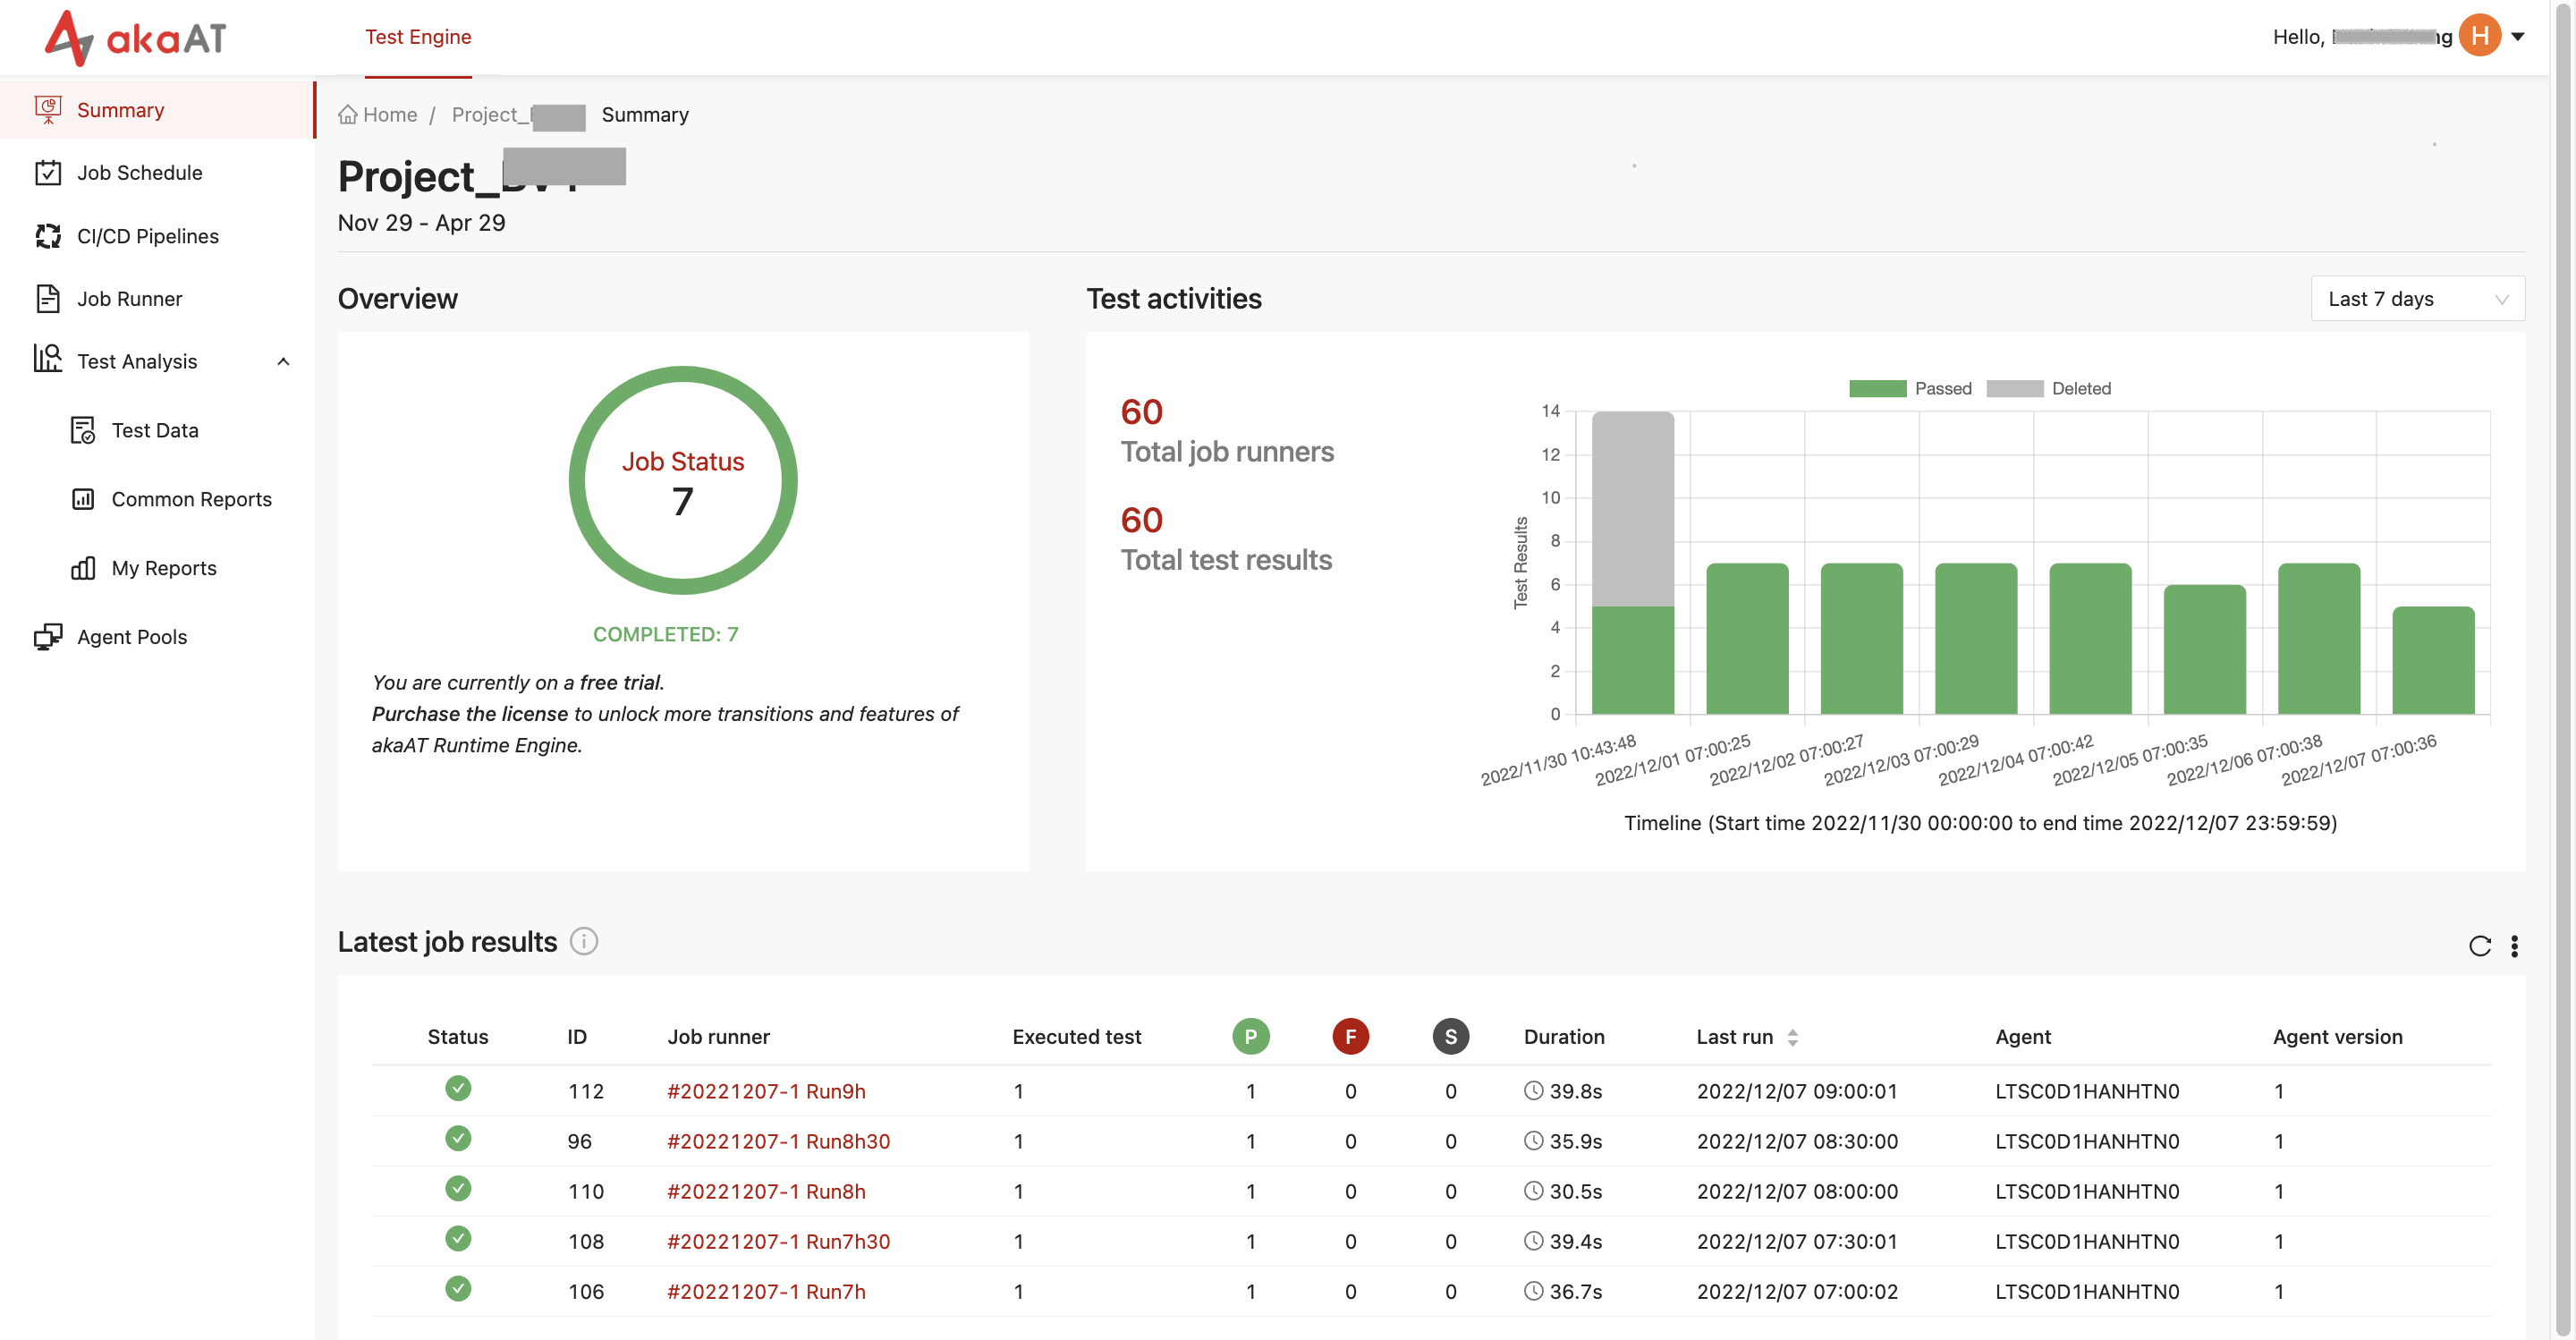
- Overview
- Job Status will show you percent of each status result of all job that run
- Test Activity will show combo (Line & Column) chart with the count of total job runners and total test results
- Chart will be automatically updated for you viewing
- You can select period of time to show in chart
- Today
- Yesterday
- Last 7 days
- Last 30 days
- Since started
- Latest job result will show table list of 5 latest test results