akaAT Dashboard
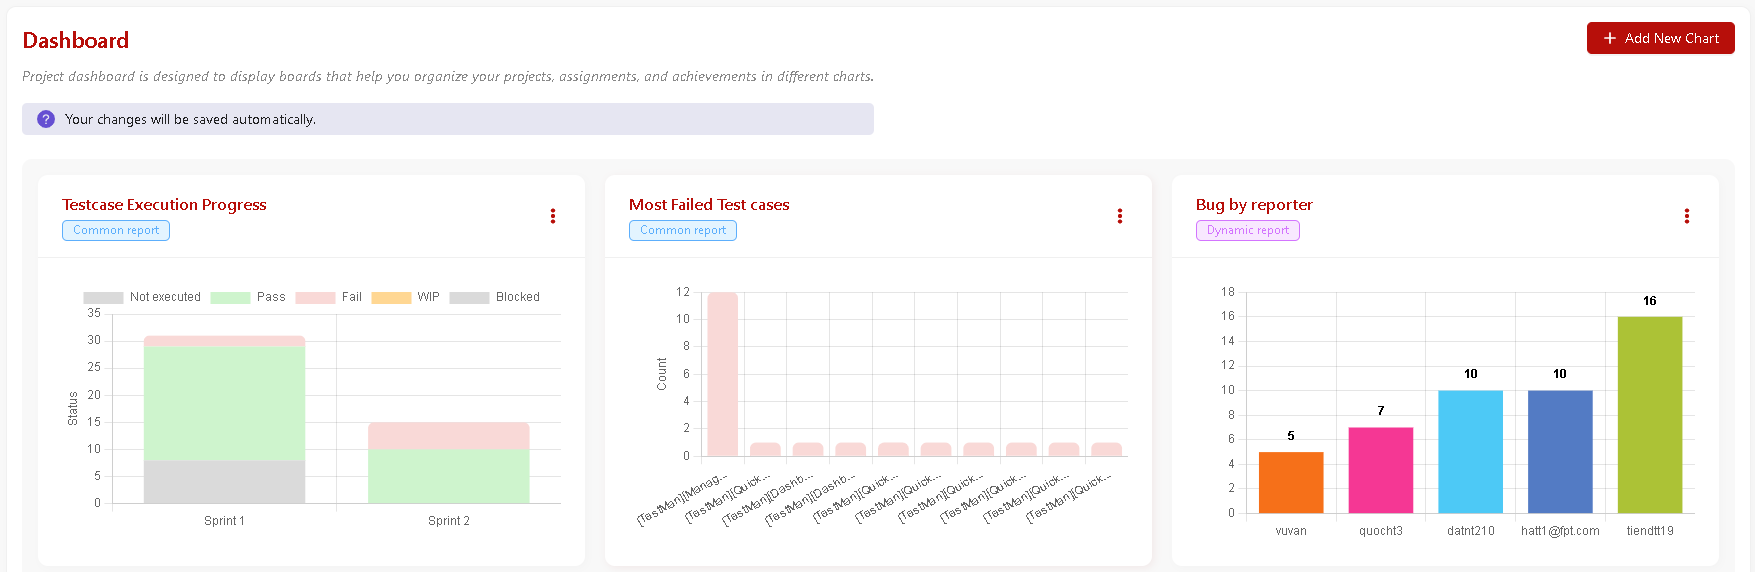
Your Dashboard is the main display you see when you log in to your project. You can customize your Dashboard by adding common charts and dynamic charts to keep track of assignments and tickets in your project. It's designed to display widgets that can help you organize your projects, assignments, and achievements in different charts.
To work with Dashboard, you will first need to log in as a user with the Project Admin role to customize the dashboard.
View chart detail
You just need to click on the chart to see its details.
Add new chart to dashboard
-
Select Dashboard in the sidebar.
-
Click on

-
Select a chart that you want to add to dashboard
Prerequisites - You must have existed dynamic charts that not being added to Dash Board, Create one
Each chart can only be added once in the dashboard
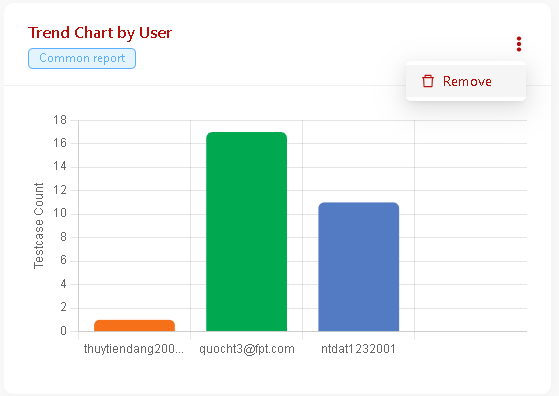
Remove chart from dashboard
After removing, you can still add that chart to the dashboard (if needed).
-
Select Dashboard in the sidebar.
-
Select More actions icon > Remove.
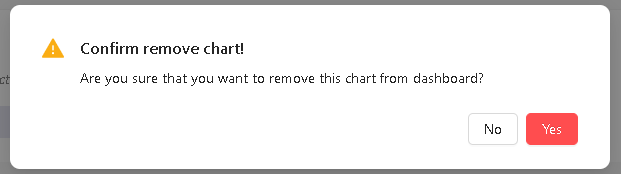
- Select Yes to confirm.
Edit dynamic chart
You can only edit Dynamic chart (Common chart cannot be edited).
-
Select Dashboard in the sidebar.
-
Select More actions icon
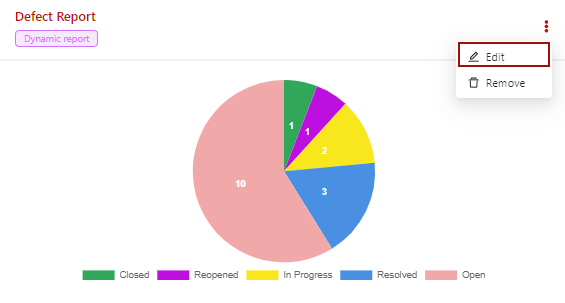
System will navigate to Edit dynamic chart screen for editing
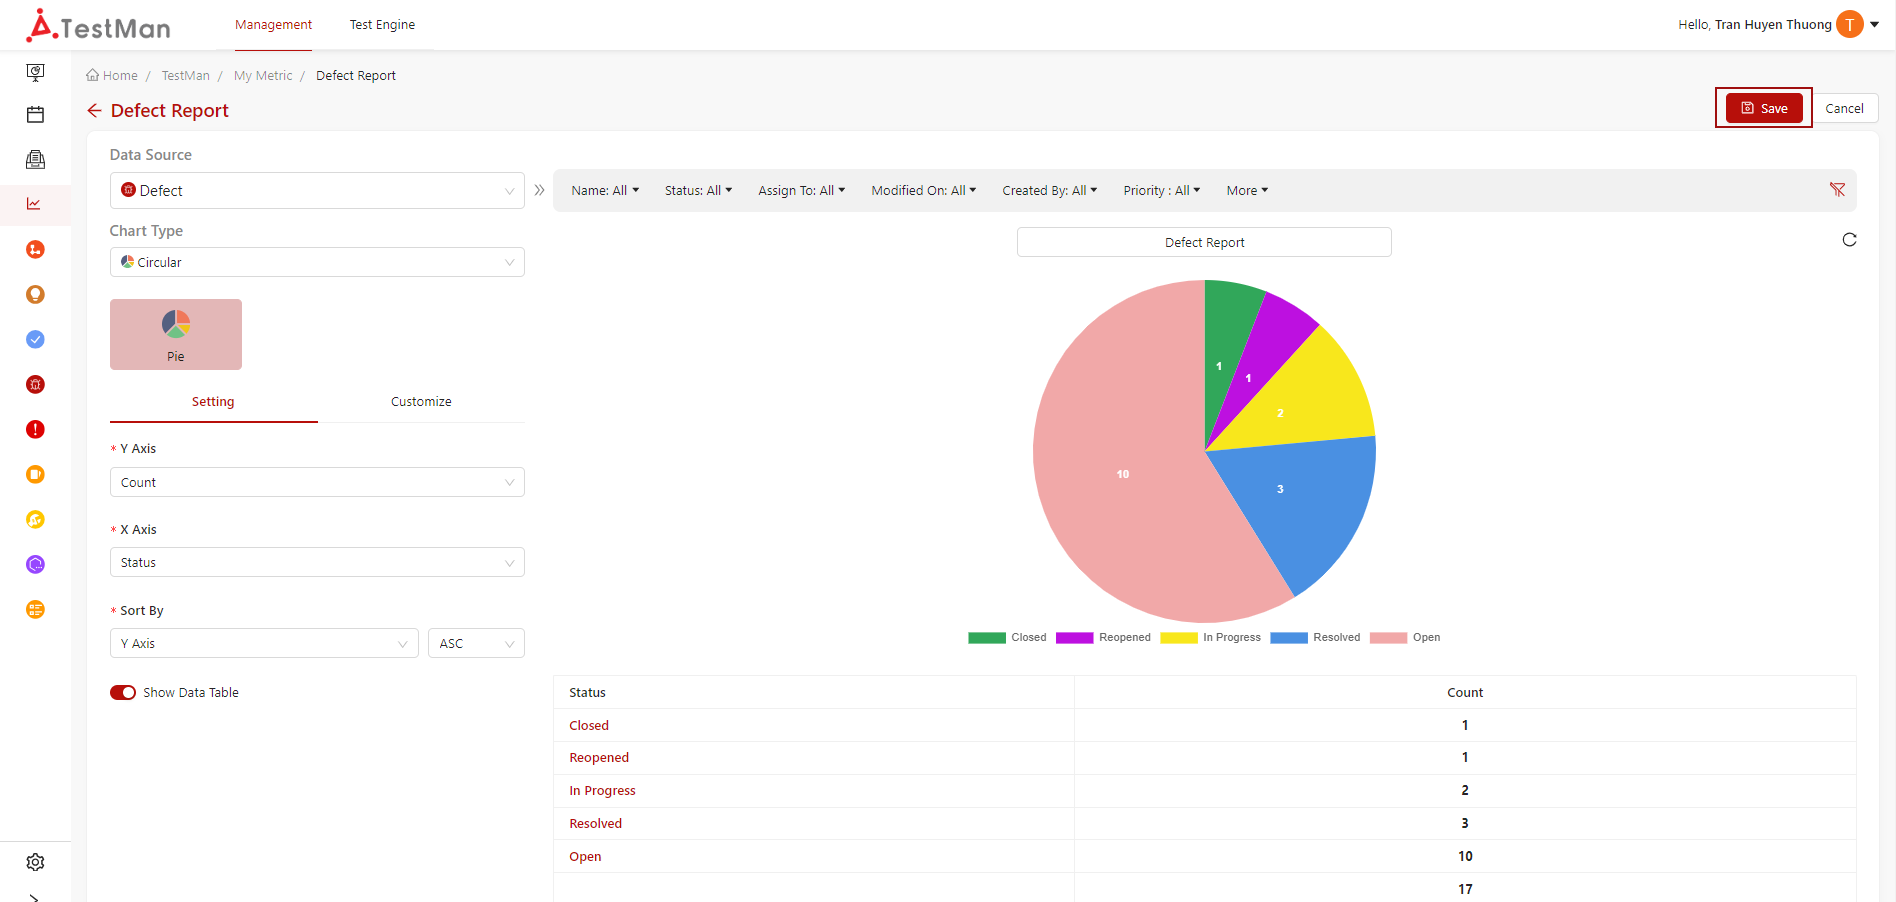 3. Make edits and Save.